Report Builder
Last updated September 4, 2026
The Reports page answers the questions most agencies ask every month. The Report Builder answers the one you have right now: show me exactly these bookings, with exactly these columns, totalled this way. You pick the fields, add filters, group rows with subtotals, and the numbers update as you go. Save it and it is one click away next time; share it and your whole agency can open it; export it and you have a CSV of exactly what is on screen.
The builder and the Reports tabs always agree. Both read the same rules for what counts as a sale — a cancelled booking, a rebooked one, or a trip you marked as agent travel is left out of both, and the builder says so under the table ("4 cancelled not counted · $81,200.00"). A total you build here is the same total the Revenue tab would show for the same rows.
Perfect for: a supplier's year with you before a call, everything overdue from one cruise line, an advisor's Q3 with expected and received side by side, a client list by state for a mailing, or the exact export your host agency or accountant asks for.
Opening the Builder
Go to Reports and click Build a report. You land on a bookings report for this year with the columns most people start from: supplier, client, booking date, travel start, confirmation number, cost, expected income, commission status and received income.
The screen has three parts:
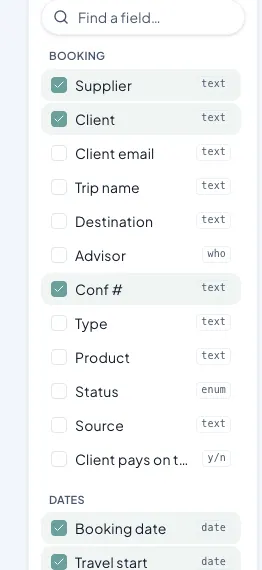
- Fields on the left — everything you can add to the report, grouped by what it describes. Click a field to add it as a column; click it again to take it off.
- The report in the middle — your rows, a filter row above them, and a totals row underneath.
- Column details on the right (on a wide screen) or behind the Column details button — sort, group, filter or hide whichever column you last clicked.
Choosing What to Report On
The dataset picker at the top decides what one row is:
| Dataset | One row is | Good for |
|---|---|---|
| Bookings | One booking, with its trip, client and commission | Sales, supplier mix, what a client has booked, commission by booking |
| Commissions | One commission entry from your ledger | What is expected when, what has landed, what is overdue |
| Trips | One trip, with its sales and commission rolled up from its bookings | Trip volume, destinations, what each trip sold and earned |
| Clients | One client | Mailing lists, who travels most, clients by advisor |
| Leads | One lead | Where leads come from, what stage they reach, who converts |
Switching datasets starts a fresh report, because the fields are different.
On a Trips report, Expected income is the supplier commission across the trip's counted bookings, and Advisor share, Received income and Outstanding are available alongside it. They count exactly the bookings Sales counts, so a cancelled booking leaves both figures together. A trip with no commission recorded yet is left blank rather than shown as $0.00, because on most trips a zero means it has not been filled in.
Dates and Scope
Two controls sit beside the dataset:
- The date the range applies to. A bookings report can run on the booking date (when it was sold), the travel start date, or the day it was entered. A commissions report can run on the expected date or the received date. Pick the one that answers your question — "what did I sell in March" is a booking-date question; "what is travelling in March" is a travel-date question.
- The range — the same presets as the Reports page (this month, year to date, last 90 days, and so on) or a custom pair of dates.
A booking with no booking date counts on the day it was entered. If you imported history and never set sale dates, those bookings all land on the import day. The dashboard tells you when this is happening; fix it by setting the date on the booking.
Advisor. Owners and admins can run the report for the whole agency or for one advisor. An advisor in a team workspace always sees their own book, whatever the report says.
Filters
Click + Filter above the table, or choose Filter… from any column's menu. A filter is a field, a condition and a value:
- Text fields: contains, does not contain, is exactly, is blank, is not blank
- Money and number fields: is at least, is at most, is between, is exactly
- Dates: is after, is before, is between, is blank, is set
- Choice fields like status or commission status: is any of, is none of
- Yes/no fields: is yes, is no
Filters stack — every row shown matches all of them. Each filter is a chip above the table; click its × to remove it.
Filters read the value you see in the column. "Commission status is any of Overdue" means exactly the rows whose status column says Overdue.
Sorting and Grouping
Click a column header for its menu:
- Sort — largest or smallest first for numbers and dates, A to Z or Z to A for text. Blank values always sort last.
- Group by this — one heading per distinct value (per supplier, per advisor, per month), with a subtotal on every money column. The grand total stays at the bottom.
- Move left / right — reorder the columns.
- Hide column — take it off the report.
When a report is grouped and sorted on a money column, the groups themselves follow the sort, so "group by supplier, sort by cost largest first" puts your biggest supplier at the top.
Totals
Every money column totals at the bottom; number columns show a sum or an average depending on the field (commission % averages, bookings count sums). Text and date columns have no total. The Column details panel says which it is for the column you clicked.
Commission Status
The Commission status column on a bookings report uses the words most advisors already know:
| Status | Meaning |
|---|---|
| Upcoming | Commission is expected and the expected date has not passed |
| Overdue | The expected date has passed and nothing has been received |
| Partial | Some of the expected commission has been received |
| Received | The full expected commission has been received |
| Not recorded | The booking has no commission entered yet. This is not the same as non-commissionable — it usually means the figure still needs to be filled in |
| Non-commissionable | You marked the booking as earning no commission |
Saving and Sharing
Save names the report and keeps it. Saved reports open from the Saved menu in the builder, and the Reports page lists them too. Reports are yours by default; switch on Share with the agency and every advisor can open it — they still cannot change it, only you can. Save as copy lets a teammate keep their own version of a shared report.
The name at the top of the page is the report's name; click it to rename.
Exporting
Export CSV downloads exactly what is on screen: the columns as shown, every row the filters keep (not just the first 500 the screen shows), group headings with their subtotals when grouped, and the totals row last. Money exports with two decimals, dates as YYYY-MM-DD, yes/no as Yes and No. The advisor scope and the "not counted" rules apply to the file exactly as they do on screen.
Large Reports
The screen shows the first 500 rows and says so under the table ("Showing the first 500 of 6,114 rows"). The totals are for all of them, and the CSV carries every row.
Tips
- Start from the column you care about. Add it, click its header, and sort or group. Most reports are two clicks from the default.
- Group by advisor, then sort by expected income for a quick look at who has the most commission still to land.
- Commissions dataset with "Received on" as the date answers "what money arrived this month", which is a different question from what was booked this month.
- Group by month using the booking date is not a field yet; use the range instead, or export and pivot in a spreadsheet.
- A saved report keeps the range preset, not the dates it resolved to — "This year" opened next January is next year.
This is part of JourneyFuse’s travel agency software: team roles, permissions and agency-wide settings.
Related Articles
Security & Data Privacy
How JourneyFuse protects card data, client information and your agency's data — how cards are encrypted and stored, how long we keep them, and our promise never to share your clients.
Contractor Agreements
Keep an agreement per role, send one or more for e-signature with each person's pay terms, counter-sign as the agency, and download the executed PDF.
API & Make.com / Zapier Integration
Read and write your leads, clients, trips, bookings, and quotes from your own scripts or no-code tools like Make.com and Zapier using the JourneyFuse REST API.